












LOGO
Contact

Power BI Services for Centralized Business Intelligence

Integrating Microsoft Power BI solutions into your enterprise data ecosystem for advanced data visualization and business intelligence.


Hello Prenup USADaifuku USAThe Fuel Store UKSDS Drives UKIRRUS NetherlandsEMCS Advisory LTD MaltaWells Insurance USAMarketing Labs UKRIKAZ OmanRIOT GLASS USAHello Prenup USADaifuku USAThe Fuel Store UKSDS Drives UKIRRUS NetherlandsEMCS Advisory LTD MaltaWells Insurance USAMarketing Labs UKRIKAZ OmanRIOT GLASS USAHello Prenup USADaifuku USAThe Fuel Store UKSDS Drives UKIRRUS NetherlandsEMCS Advisory LTD MaltaWells Insurance USAMarketing Labs UKRIKAZ OmanRIOT GLASS USAHello Prenup USADaifuku USAThe Fuel Store UKSDS Drives UKIRRUS NetherlandsEMCS Advisory LTD MaltaWells Insurance USAMarketing Labs UKRIKAZ OmanRIOT GLASS USAHello Prenup USADaifuku USAThe Fuel Store UKSDS Drives UKIRRUS NetherlandsEMCS Advisory LTD MaltaWells Insurance USAMarketing Labs UKRIKAZ OmanRIOT GLASS USAHello Prenup USADaifuku USAThe Fuel Store UKSDS Drives UKIRRUS NetherlandsEMCS Advisory LTD MaltaWells Insurance USAMarketing Labs UKRIKAZ OmanRIOT GLASS USA

Harnessing the capabilities of Power BI to help organizations become data-driven with custom BI dashboards and actionable insights

Organizations often hit a breaking point when teams can’t get insights out of enterprise data assets. Multiple software tools that don’t talk to each other, static reports, and growing data volumes cause operational frustrations. At SHALIGRAM , we deliver trusted reporting, governed data, and consistent metrics through Power BI, coupled with data engineering, cross-platform integrations, advanced analytics, and AI.

Gartner recognizes Microsoft as a Leader in its Magic Quadrant for analytics and business intelligence platforms. We use Power BI to build a scalable data ecosystem by connecting disparate sources into a single source of truth for faster decision-making. 

Challenges organizations face with fragmented reporting and analytics

Data scattered across multiple systems

Our team builds automated pipelines and centralizes star-schema models to prepare and structure data for Power BI reporting.

Manual reporting and spreadsheet dependency

We reduce spreadsheet dependency with governed self-service Power BI reporting, helping users explore and build reports with less dependence on IT.

Lack of real-time business visibility

Our team connects isolated data sources using appropriate Power BI connectivity modes, including DirectQuery for scenarios requiring low-latency access.

Inconsistent KPI definitions

We build governed semantic models to standardize KPI definitions and use data lineage to track dependencies.

Delayed business decision-making

We configure scheduled or supported refresh mechanisms to keep reports and dashboards updated, helping leaders make timely decisions.

Difficulty analyzing large datasets

Our experts improve data models, DAX, and underlying database architecture when working with large datasets.

Limited cross-functional visibility

We deploy shared enterprise semantic models and structured governance frameworks for teams to view KPIs and relevant cross-functional data.

Low adoption of reporting tools

We use Power BI capabilities to make only role-relevant metrics visible and centralize them for faster adoption.

Power BI services we offer

NLP consulting strategy

Power BI consulting and strategy

Our consulting approach is based on defining KPI frameworks, recommending Power BI architecture, and designing executive dashboards aligned with your business objectives.
data-lake-implementation

Power BI implementation services

Our experts configure the Microsoft Fabric and Power BI tenant settings, support licensing, configure gateways where required, and integrate Power BI with ERP, CRM, and cloud data platforms.
Dashboard integration

Custom dashboard development

We design custom interactive dashboards, structuring layouts around the KPIs that C-suite decision-makers need most. Power BI reports are embedded into your enterprise apps or SaaS products.
reporting-dashboard-development

Power BI report development

We build custom report themes to match brand guidelines and configure paginated reports for printing and data exports used by finance or audit teams.
Model deployment

Data modeling and transformation

Our team uses Power Query (M) to clean, merge, append, and shape data from disparate enterprise systems while designing data architectures optimized for reporting performance.
AI integration services

Power BI integration services

Our experts integrate AI-powered capabilities, including Copilot-enabled Power BI experiences where supported, into enterprise reporting workflows to accelerate analysis.
business-intelligence-solutions

Embedded Power BI solutions

Our core offerings include Power BI Embedded architectures for scalable application analytics, including capacity planning, multi-tenant deployment patterns, workspace architecture, and row-level security.
Enterprise application migration

Power BI migration and modernization

We prioritize the data and reports that need to be migrated, build POCs to validate assumptions, and deploy in stages while refactoring, modernizing, and consolidating existing solutions.
Automation support

Power BI support and optimization

Our experts handle incident management, data and refresh issues, tenant activity monitoring, DAX optimization, and Power Query (M) performance improvements.

Our numbers reflect our commitment

0+Years of Experience
0+Technology Experts
0+Projects Delivered
0+Global Clients

Power BI solutions built for business intelligence and analytics

Custom Power BI solutions that turn fragmented data into intelligence, accelerating strategic decisions and scaling operational performance

We deliver interactive visual reporting tools that connect your company’s raw data sources to track specific business goals in real time using centralized data models and Power BI visuals. Visual cards track performance metrics, and interactive visuals help you view details by region, department, or time frame.

  • Centralized data hubs
  • Region and department drill-downs
  • Performance metric tracking

Business outcomes enabled through our Power BI services

Improved decision-making

We replace guesswork with fact-based choices by transforming disparate data into easy-to-read dashboards.

Greater business visibility

We help you eliminate blind spots by unifying data using Power BI’s native connectors and advanced data integration tools.

Faster reporting cycles

We build automated pipelines to pull data, transform it, and make reports available to users through dashboards.

Reduced reporting effort

We automate data extraction and transformation workflows and use Power Query to create repeatable data preparation processes.

Higher data accuracy

We design centralized semantic models and apply data-matching and validation rules to improve consistency and accuracy.

Stronger KPI alignment

We replace fragmented sheets with centralized data models and write centralized DAX formulas for identical metric calculations.

Faster access to business insights

We use Microsoft Power BI built-in connectors to bring data into reports, refresh/query data, and help teams identify relevant trends.

Increased operational efficiency

Our Power BI solutions automate how information flows and updates, helping eliminate manual reporting and break down data silos.

Improved executive reporting

Our solutions provide a view of current business health and self-service drill-down features to improve executive reporting.

Better business performance monitoring

Our Power BI solutions calculate custom business metrics, ratios, and year-over-year growth automatically for better visibility into operations.

Data-driven organizational culture

We empower frontline workers and executives to explore information through a shared, trusted, and interactive data environment.

Our approach to Power BI implementation

01

Discovery and reporting assessment

We review existing data sources, map out required data connectors, and establish a blueprint for Power BI implementation.
02

Data source evaluation

We analyze connections, data quality, credentials, data accessibility, and determine the integration methods.
03

Data modeling and transformation

We build clean semantic models, set up table relationships, and write efficient data analysis DAX measures.
04

Dashboard and report development

Our team develops reports and dashboards, configures refresh schedules and alerts where required, and optimizes layouts.
05

Testing and validation

Our experts validate data accuracy, calculations, visual behavior, filters, interactions, and report layouts across supported devices.
06

Deployment and continuous optimization

We audit slow-loading reports, optimize data models, track CPU usage, memory consumption, and refresh schedules.

Our Power BI services across industries

We provide strategic BI consulting for manufacturers to eliminate data silos and optimize factory floors to supply chains. We integrate ML outputs into Power BI to monitor production performance and forecast equipment failures before they disrupt production.
Recent projects & case studies

From startups to enterprises – see how our expertise in software consulting and development in the USA has led to measurable impact across industries.

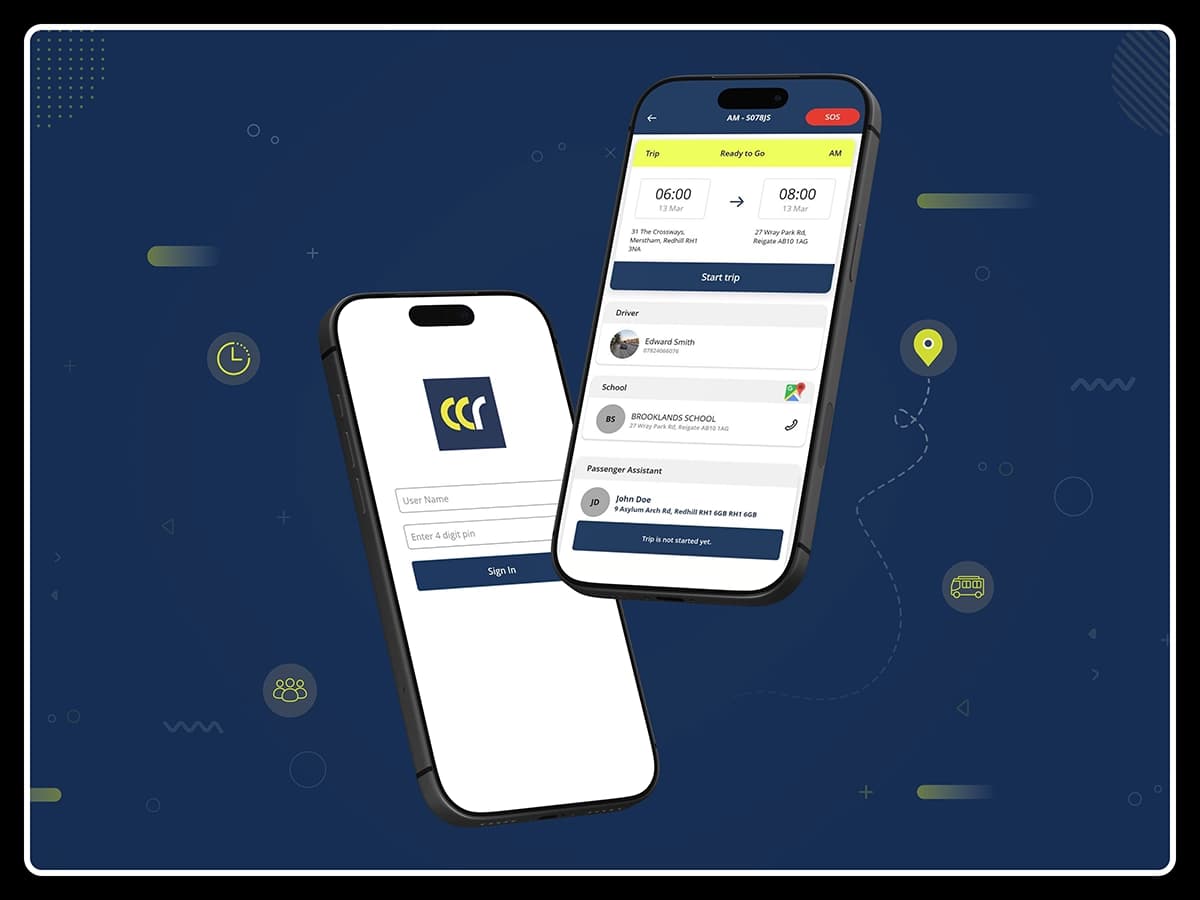
Courtesy cars redhill

A smart connected student transportation ecosystem for secure daily commutes

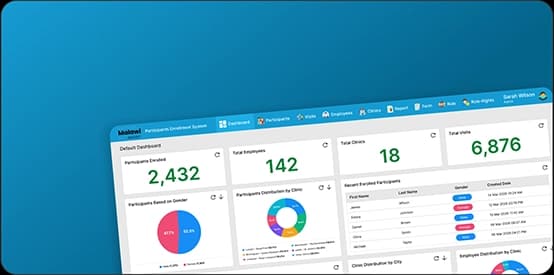
SHALIGRAM built a H2S platform that connects drivers, passenger assistants, office staff, schools, and parents through one secure platform.

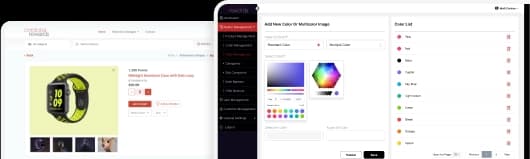
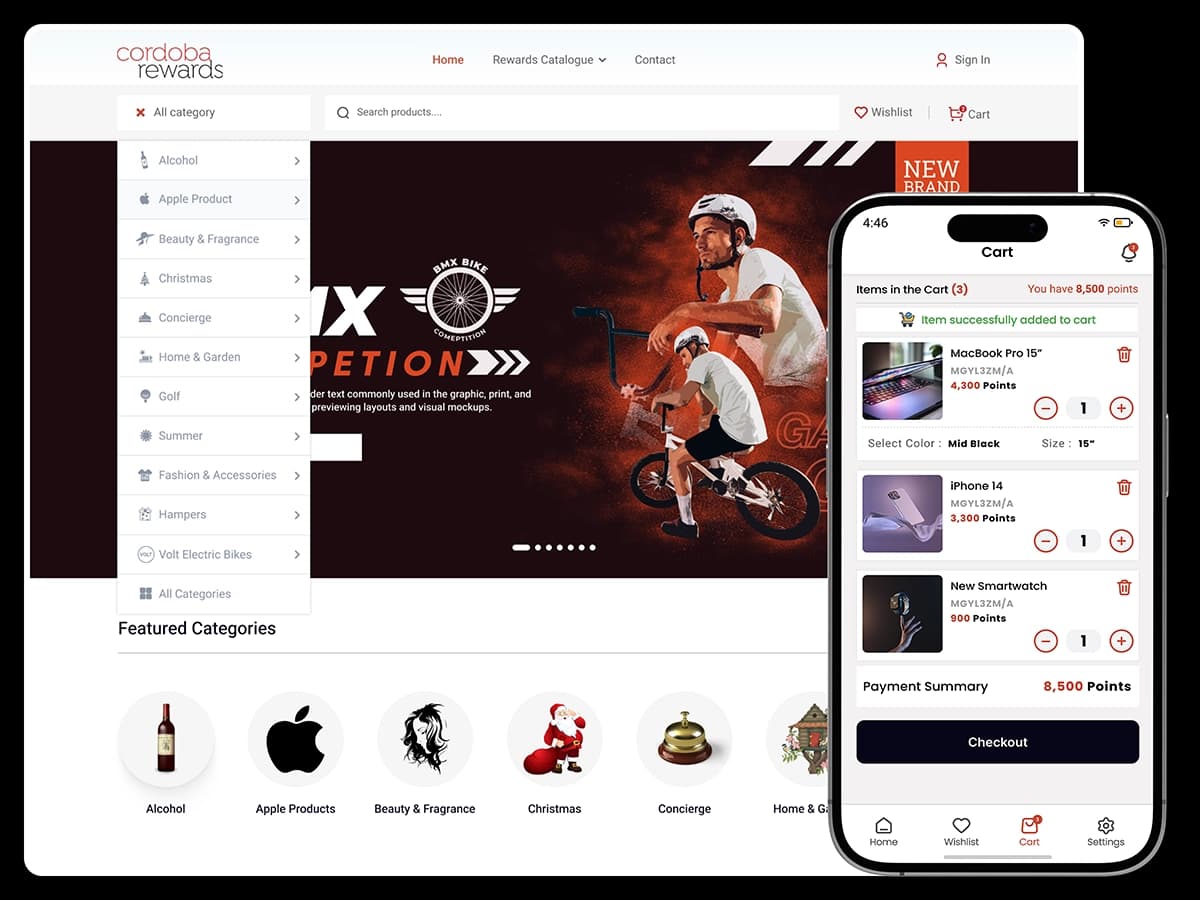
Cordoba Rewards

A scalable rewards platform built to move as fast as Cordoba grows

Built a scalable Progressive Web App with fast tenant onboarding, push notifications, and continuous UK based development, powering Cordoba Rewards growth.

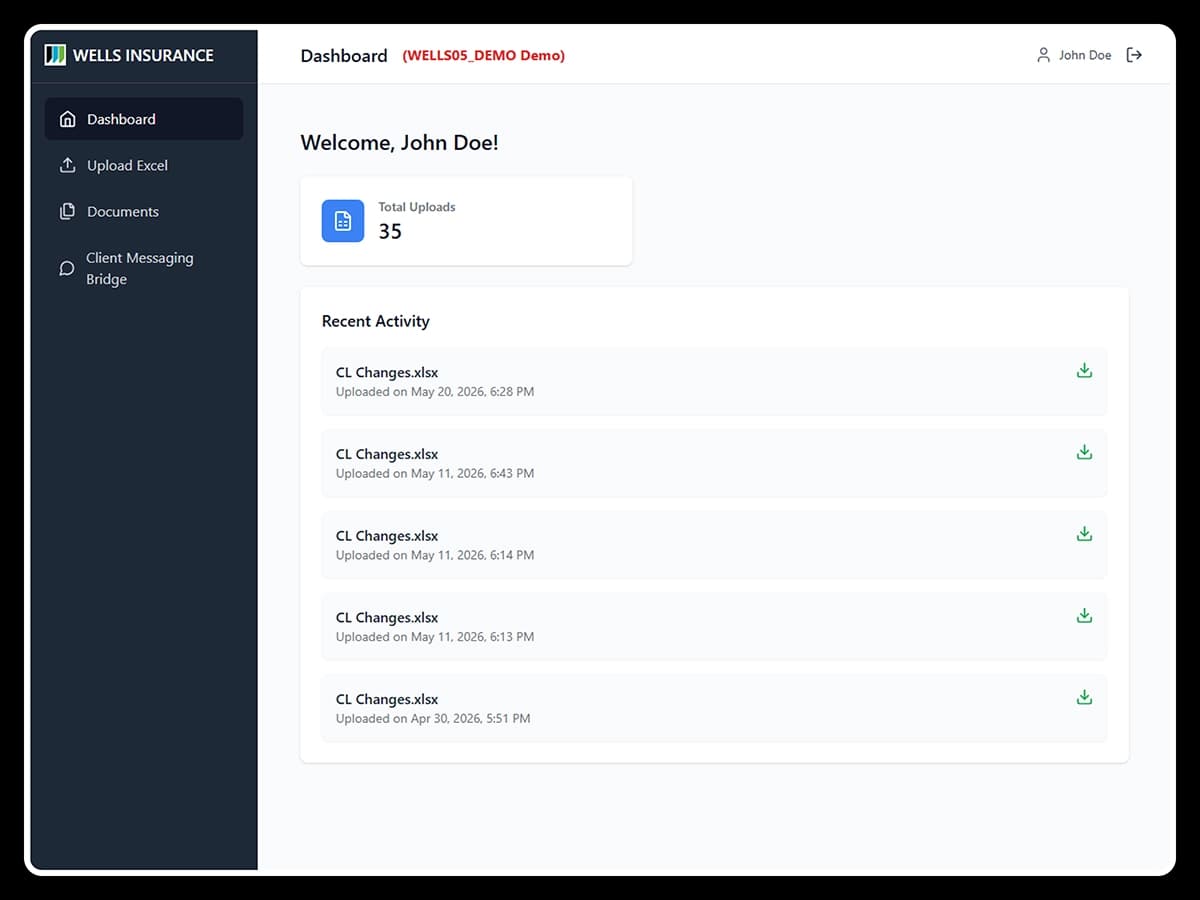
Wells insurance

An automated applied epic to streamline workflows and manage end-to-end policy lifecycle efficiently

SHALIGRAM helped Wells Insurance with an automated insurance management system to improve workflow efficiency and strengthen client service strategies.

Why organizations choose SHALIGRAM for Power BI services

Salesforce migration visualization

Driving end-to-end enterprise BI

At SHALIGRAM, our certified data engineers design Power BI solutions around your business strategy, enterprise KPIs, data architecture, and governance requirements. We build solutions with applicable security, privacy, and regulatory requirements in mind, including GDPR and HIPAA where relevant.

  • End-to-end Power BI architecture and deployment
  • Deep industry domain expertise
  • Global deployment and support capabilities
  • Compliance-focused solution design

Turn your disconnected spreadsheets into a single source of truth with our Power BI services.

Transform your fragmented business data into strategic decisions. Solve your toughest reporting bottlenecks by connecting with our experts.

FAQs

We transform the data through Power Query and build a centralized semantic model to unify scattered data.